What is Back-testing and why Should I do it?
Back-testing is what many professional traders do in order to find a strategy that generates the best RORAC (return on risk-adjusted capital) in the long run. It's tedious and takes a lot of work, you must make sure you do it accurately, and sometimes you put in a lot of work only to find that your strategy does not actually generate the Alpha you were looking for. Back-testing and finding that a strategy doesn't work well is actually positive, as it tells you confidently that you should not be trading that strategy. On the other hand, if a strategy does work, you can use your back-test data to then optimize your strategy's entry level, stop loss and take profit levels to achieve even more profits.
All back-testing is, to put it simply, is using historical financial data (whether that be price movement or fundamentals [I recommend using either fundamentals or both]) and quantitative data analysis techniques to see how a setup and trade management system would have held up over a period of time. If you don't do this testing, you will spend your entire trading "journey" testing out strategies, having a few losing trades, assume they don't work and try new ones, over and over again. Bellow are some reasons that retail traders fail to make profits consistently in the long run, and they can all be avoided with back-testing:
- They don't know the statistics of their strategy and lose confidence when it doesn't work immediately.
- They don't have a strategy that actually works.
- They have a good entry but don't know the best way to manage the trades.
Again, all of these problems can be avoided and solved by properly back-testing your strategies!
I am also going to talk briefly about the whole idea of hyper-active trading, because I am tired of seeing so many people losing money and getting margin calls! It is important to note that nothing in the above list is actually the biggest reason retail traders lose money. The real biggest reason why retail traders lose money is because they believe the narrative of actively trading multiple times a week or more and making insane returns that they could live off of. Brokerages, trading platforms, trading "educators" and so on are heavily incentivized to trick people into this narrative.
If you are thinking of trading a purely technical trading strategy, especially if it involves relying on indicators and/or price action alone, please be aware that it is incredibly unlikely that you will make money in the long run. Most real professional trading strategies involve fundamental catalysts and holds lasting weeks if not months or years (otherwise known as just, "active investing"). This is simply because lines or price moving in certain way on the chart has absolutely nothing to do with how well a company is doing or what might change the exchange rate of a currency pair. Most of it is just noise!
You'll see tons of people online who claim they make a living trading purely off of a chart, and often that they can teach you to do the same, but have you ever met someone in real life who can actually do that? I doubt it. Please watch this video about the conflicts of interest in the trading industry before you proceed.
Download my Back-testing Spreadsheet
I have created a large, complicated (to me at least, I was new to Excel formulas when I made this), spreadsheet that I use to back-test trading strategies. I'll be using this in this tutorial.
The link below is the current most updated version of the spreadsheet. It includes simple profit calculations, win-rate, realized R:R, stop loss optimization, profit target optimization, and expected return for up to 1,000 trades.
Choosing your Data
The first step to back-testing your strategy is to figure out what kind of data you are going to back-test on. You will want to test your strategy on all the markets you will be trading. If your strategy is for trading one specific market, like a currency pair or a commodity, you will obviously be fine just testing on that. However, if you are back-testing an equities strategy, you will want to test on many stocks and diversify the sectors your are grabbing your data from. Make sure that you have access to many years of data for whatever markets you need to back-test on. This can be tricky sometimes depending on how much data you actually need, but my favorite stock charting website/platform by far is TradingView, which has plenty of data for most back-tests.
Often times professional trading strategies will require more detailed types of data besides price movements, like fundamentals, and this type of data can be even more difficult to come by, especially when you are talking about decades ago. Take a look at the site macrotrends.net, as it has lots of historical fundamental data, and you can often pull up historical balance sheets by the year and by quarter (however, unfortunately, it seems this only goes back to 2005 for many of even the oldest of stocks).
If you want to back-test a strategy that involves news catalysts or other real-time happenings like insider trades, good luck! It's all about finding the data from many years ago to go through and find entry points. If you can do that, you can back-test it.
Important: Make sure to go back as far as you can. That way, you are not skewing your results with any unnaturally long bull run like we have seen recently in the equities market, practically putting the stock market on "easy mode".
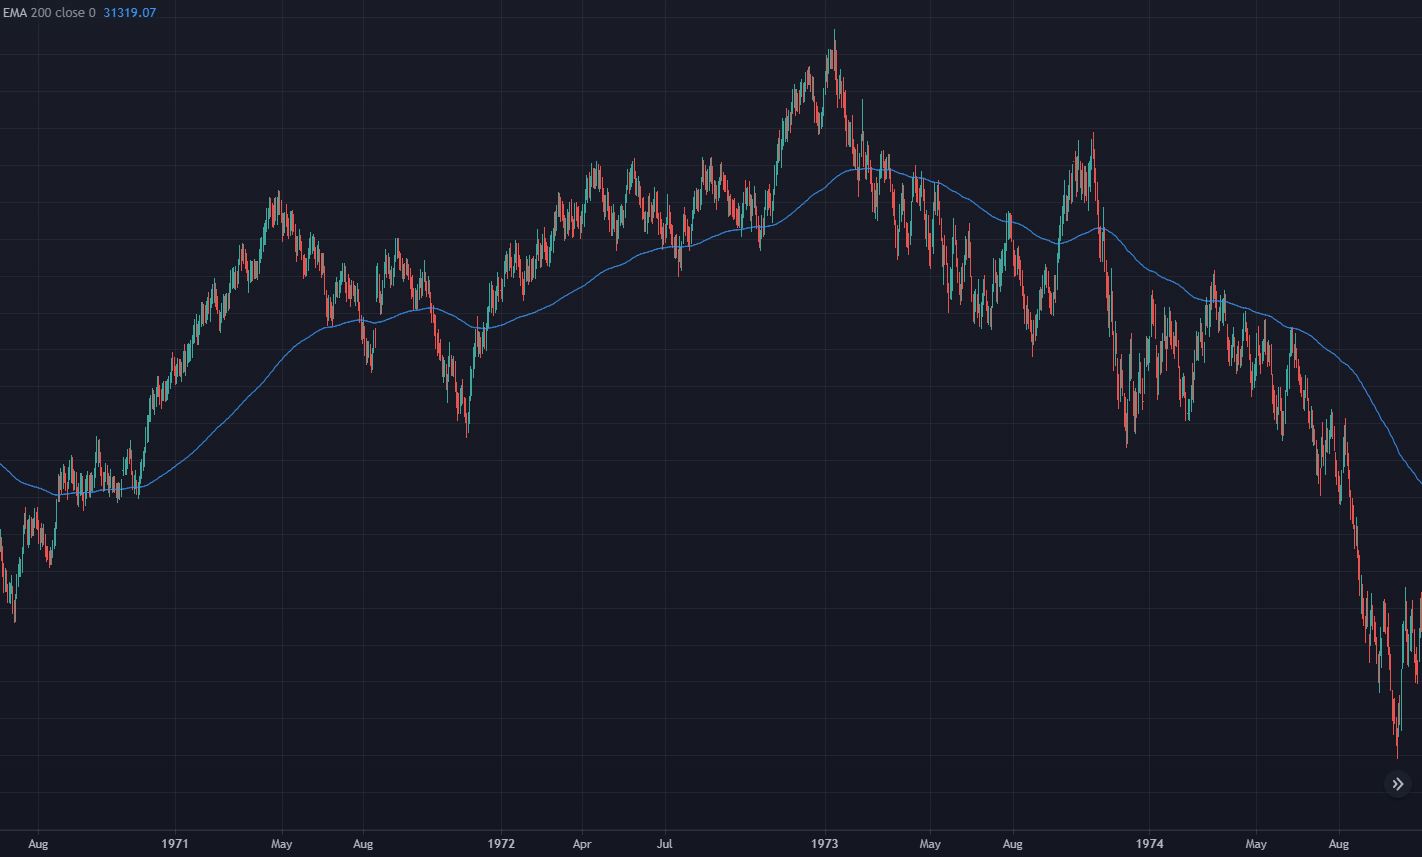
Take a look at this $DJI chart from the 70s:
This sort of ranging market condition quite probably will happen at some point in your lifetime. It's O.K. for an investment strategy to be doing worse than it does in more trending markets, but if you lose everything in your account over it, or give back too much of your prior profits that your RORAC is in the toilet, that's not good.
Recording Trades
Doing the actual back-testing is the boring "grind" part of this work. It will probably take you multiple days or even weeks to completely back-test a single strategy depending on how much data needs to be compiled, what calculations need to be done, and how complicated the overall strategy is to compute.
For technical strategies (keep in mind my warning at the start of this post), the basic gist of recording trades consists of going through and looking closely at the chart, identifying exactly where your entry criteria is met, and recording exactly how the trade went into the spreadsheet. You must go through the chart and take every single trade that met your criteria. Do not skip around to random places and find random entries. Go 100% linearly through the data to avoid skewing your results.
For more thorough strategies that involve fundamental data, you must go through said data, find where your trade criteria is met, and then go to the chart and find the price it was at that time.
The following will explain how to input trades into my specific spreadsheet, but it should apply to pretty much any back-test if you are not going with my template.
Throughout this process I will also be using TradingView, as it has very intuitive and fast tools for back-testing. I highly recommend TradingView for this kind of work!
When you are back-testing, at all times, you MUST make sure to never, EVER let data from after the entry point alter how you would have entered the trade.
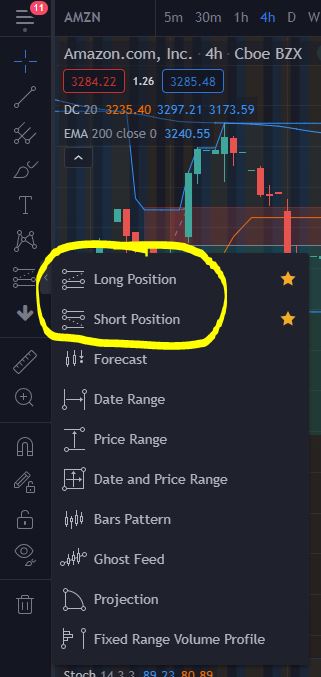
As you start going through the chart you are going to back-test first, from the starting point, find the trades and draw out the "Long Position" or "Short Position" drawing tools from the entry point to the exit points. See how the trade went by dragging out the tool after setting the exit levels and input the total profit in whatever units you want to use into the first column in the spreadsheet. If you are using a fixed share/lot count for your strategy, you should probably input the profit in points or currency, whereas if you are using dynamic position sizing to say, 5% of your account capital, you should probably input the profit in terms of percent gain or loss.
(Optional) Inputting Data for Exit Optimizations
The spreadsheet I have provided above has two features to help you figure out better exit strategies on fixed-exit-level (R:R) based exit methods:
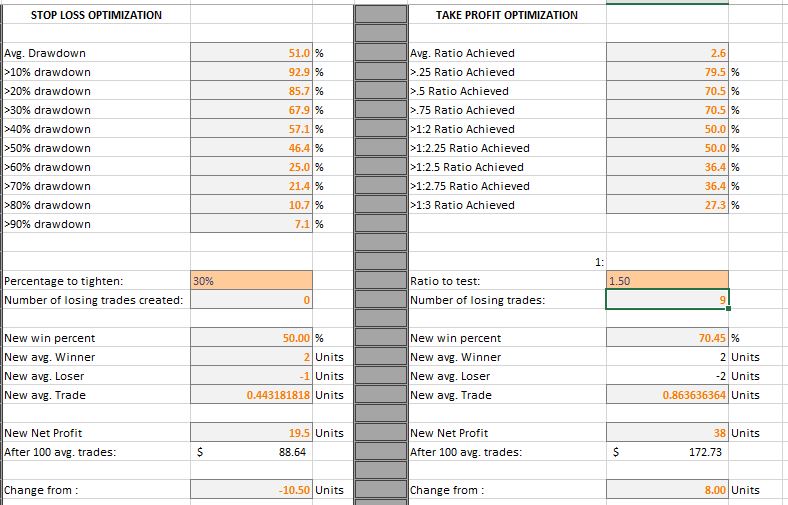
Stop-loss optimization calculates the return of the strategy had you tightened your stop by a certain percentage, taking into account the trades that were winners that turned into losers, but also the amount of loss saved by tightening the stop.
Take-profit optimization helps you determine how far you should be looking to let your winners go for the best profit in the long run, taking into account the losing trades created by increasing the risk:reward ratio, but also the amount of extra profit gained from the larger winners. You may even find a strategy working better by lowering the ratio, although this rare for anything other than scalping setups.
Again, this only applies if you are using fixed exit/R:R levels. If you are using a more complicated exit strategy, such as moving the stop to break even after a certain point, taking partial profits at a half-target, exiting when secondary criteria is met, or exiting when the initial entry criteria is now reversed, you will need to manually record the exact results of those positions instead of let the spreadsheet figure out the best exit strategy. There are ways to make more complex spreadsheets for these types of back-tests, and you are free to make one, but for the purposes of this tutorial and spreadsheet I will just be focusing on fixed exit levels when using stop-loss optimization (SLO) and take-profit optimization (TPO).
These features of the spreadsheet work most intuitively if you record your base profit in terms of 1:1 from your risk, and then go from there. This is simply because the TPO ratio input is a multiplier of the initial profit, and the spreadsheet calculates the maximum risk:reward as if your original profit was a 1:1 trade. Again, however, you can disregard these features if you are back-testing a more complicated exit strategy.
WARNING: I would advise against using both of these features at the same time in one back-test. This may give inaccurate results as there may be inaccuracies regarding the max. draw-down and max. profit after R:R or stop loss has been changed/tightened. For example, let's say you recorded a trade that had 20% draw-down, made the 1:1 target, then proceeded to make 50% draw-down and then went on to 1:3. If you had used the SLO and TPO features set to 60% and 1:2.5 respectively, it would count as a 1:2.5 trade and not a loser like it would have been in reality had you gone for that 1:2.5 R:R. The only time you may use both of these features at the same time is if you record your max profit as how far it went before hitting the draw-down you put for the 1:1 target.
Inputs for these Features
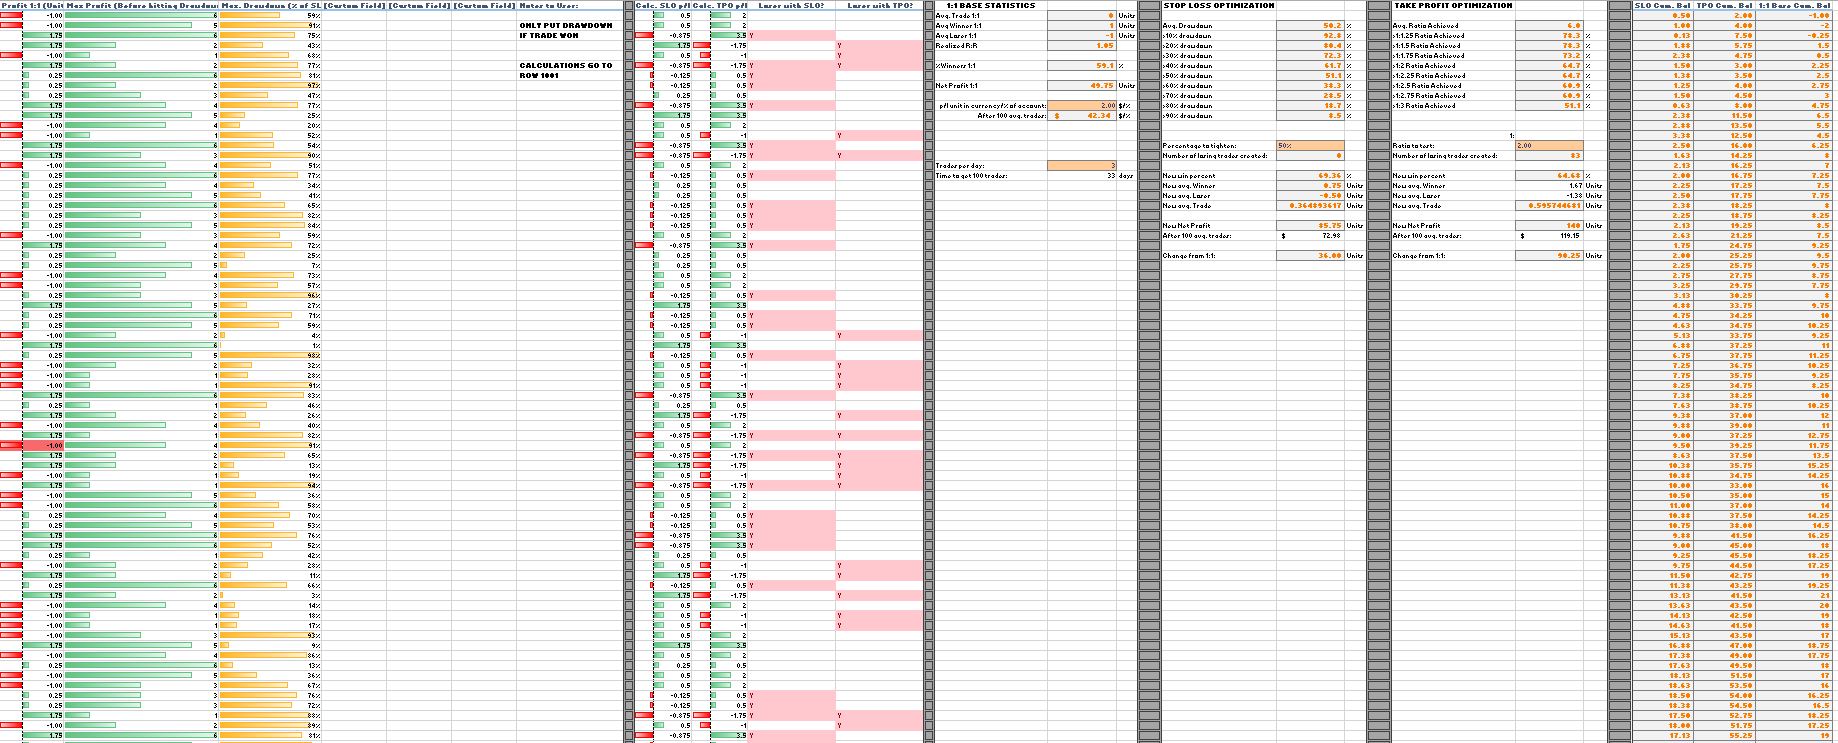
For winning trades, you need to calculate the max draw-down there was before it hit your take profit. You will also need to input how far the trade went in your favor before finally turning around and hitting your stop loss. To be extra careful, I usually record how far it went before hitting the draw-down I put for the 1:1 target. This is to avoid inaccuracies regarding the TPO and SLO tools as discussed above.
For losing trades, you will only need to input the maximum profit as the draw-down was obviously 100%. In fact, DO NOT input the draw-down if the trade was a loser as this will mess up the spreadsheet's formulas.
IMPORTANT: The max profit should be input in the p/l units, while the draw-down should be input as a percentage of the stop-loss.
Make sure to avoid over-fitting your strategy to the one data set you give it when using the stop loss and take profit optimization tools. I recommend compiling data from multiple charts before optimizing the exit levels.
Other things you may Want to Record
Hold length. You can use the "[Custom Field]" column for this if you want. If you know how long your average trade lasts, you can calculate not only the profit of your strategy, but also the efficiency of which it generates those profits. A more profitable strategy after 100 avg. trades might actually be worse than a less profitable strategy if the setups are more frequent and/or the trades take less time. It's all about how many of the setups you can take per year times the avg. return and not just the net profit!
You also need to consider how much time your are spending with your money locked up in each trade. Unless you have access to high leverege, you will need to figure out how many trades on avg. your account can actually be holding at any given time and how many you can be entering in a period of time. On top of that, if your brokerage account charges interest on that margin, make sure the strategy generates more than that interest with the margin you are using. You should also consider the extra taxes you might be paying for short-term capital gains and make sure that it beats market avg. returns with long-term capital gains (futures and FOREX are taxed differently and don't have as much worse short term gains in case you didn't know).
All of this becomes altered when you start changing the amount you risk on each trade, but then so does your portfolio volatility and potential draw-down.
Trade Record Example
The above image has the columns in a different order than they are now on more recent updates to my spreadsheet, but they are all still there and called the same thing!
Do this as many times as you like, preferably as many as you can do to get the best representation of the strategy's historical results. Some people will do 100 trades for a back-test. This works fine for more conservative longer-term fundamental-based strategies, but if you are back-testing a purely technical strategy you will need to do more. For technical strategies, I would recommend at least 500 trades.
Tip: If the strategy is not showing promise within the first 100 trades, you can either decide to stop and assume it doesn't work (which I find is likely), or continue and you might be able to make a profitable strategy out of the losing strategy by fading it. Only fade a strategy if it is consistently[i] losing money. When doing this you will start to realize that consistency is more important that the returns. It doesn't matter if the strategy is going up or down, what matters is if it is going consistently in that direction. Then you know which side of the trade to be taking.
Make sure to split up the back-test into sections, such as asset class, tickers, etc. so that you can look at the statistics for each market and figure out which ones your strategy performs best and worse on. We'll make a spreadsheet for all of the trades in the next step.
Analyzing the Results
When you have collected all the data you wish to collect, you can start to look at the data and see how it went! If you are not using the TPO/SLO tools, you can see exactly how your strategy did by looking at the "Base Statistics" area of the spreadsheet. It's that simple! Otherwise, you can fiddle around with the inputs for those features and see what exit optimizations work best to try out first.
Now you will want to generate an equity graph. An equity graph is a simple line graph that shows your account's cumulative balance over time after each trade. This is extremely necessary in order to make sure that your strategy performs consistently, which is very important to see after a back-test. If your strategy is not consistent, it may not actually work in the long run, especially if that inconsistent looking graph is from a large data set. I avoid any strategy that generates a graph that isn't always going in a relatively straight line upwards.
To make one of these graphs, select all of the cells in the column of trade p/ls that you are using as your final strategy (depending on whether you want the graph for TPO, SLO, or base data). On my spreadsheet, these are the three columns next to the optimization tools, labeled "Cum. Bal". Select all the cells with numbers in them (in the column you are using ONLY), go to the Insert tab in excel and select a line graph. Move it to wherever you wish and there you go. Hopefully, it's a relatively straight line going up. If not, you've obviously got some work to do.
What a Good Strategy Looks Like
- You should not have a very low win-rate (unless you are fine with lots of long draw-down periods and have huge winners)
- Straight-forward and consistent equity graph (very important)
- Enough setups to allow you to get more than avg. market returns per year. Extra efforts in the market need to create extra returns!
- For example, you could have a strategy that gives 1:2 R:R with 55% win-rate, but the setup only happens once a year in the markets/time-frames you are trading. This would make absolutely no sense. You would be better off just buying an index fund and holding it! Often times if you swing trade stocks or are an intraday trader, there will be plenty of setups within the market for this to be possible, but in general just make sure your setup happens enough that it is worth the time looking for.
There are more things that you want to look for, but these are the major ones that I look at before I consider a strategy for live trading.
Putting it all Together (Compiling all the Data)
Once you have finished gathering all your data, you can take all the spreadsheets of different markets and compile them into one. Don't delete the single spreadsheets but just copy the data over into a new one. Make sure to only include the 1:1 p/l, max profit and draw-down info when transferring over trades as the TPO/SLO is to be done on the entire data set to make the general strategy. The optimizations for the other markets can be taken as "variations" to trade those specific markets more efficiently than with the general strategy's optimizations, but make sure to do a full back-test on that specific market with those optimizations if you are going to go that route.
Once all the trade data has been entered, you might want to shuffle the data. Since these are all from different markets/charts, you probably won't be trading one market/chart for 100 trades, then another for the next 100, etc. You will probably be trading them simultaneously. In order to make our equity graph reflect this, we shuffle the trade data. This can be done using the Sort feature in Excel. Here is a video tutorial I found on YouTube. The only issue with doing this is your could trick yourself into thinking your strategy is consistent when in reality is is not. Shuffling the trade data will always have a chance to shuffle it in just the right way to make it look good, and the reverse is also true.
Once you've got all the data on there, there you go. Make an equity graph and fiddle with the TPO/SLO if you wish. That's about it! Do this for any strategy you want to test.
What about Automated Back-tests?
If your coding skills and platform allow you to automate back-tests accurately, then go ahead and speed the manual process up by a million times! However, I have found that the programmatic back-tests often do not provide an accurate test for even the very little-most subjective criteria.
For example, swing lows and highs after entries are technically subjective but most traders will not have a hard time agreeing on where they are, so I consider them objective enough to employ in my strategies. Let's say you need to set your stop-loss order at the most recent swing low/high for your exit plan. Almost all of the time it is obvious where this is on a chart to a human, but you can spend hours upon hours trying to code an algorithm to recognize them and it still will not be as accurate.
The above is just one example of how an automated back-test can cause more problems than it is meant to solve. I would recommend manual back-tests as you can be sure that you get back-tests done accurately (if you are honest with it of course).
Should you Trust "100 Trades Back-tested" YouTube Videos?
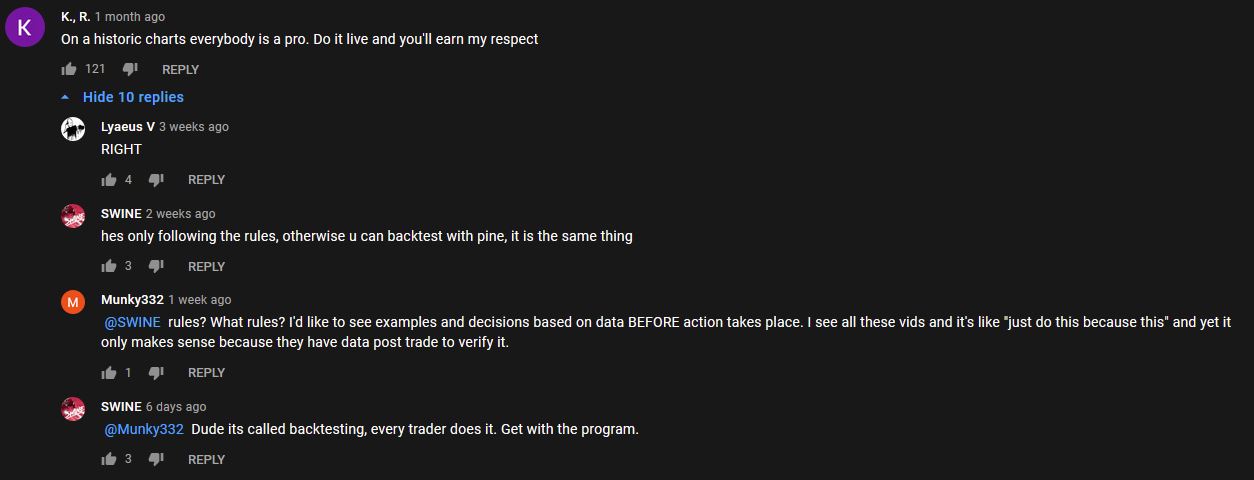
In YouTube "100 trade back-test" videos by channels like Trading Rush and Trade Pro, you will often see comment threads like this one on Trade Pro's 1 Minute Scalping Strategy Just Using 50 EMA And 200 EMA video.
These are people who are skeptical of the methods used to back-test. These are the sane and smart people, and you should always be skeptical of anyone else's work when it comes to trading. You need to see these types of videos as useful insights into the world of trading strategies, what might help and what definitely doesn't. Then you can go from there on your own and do your own testing, 5-10x more than they did including more detailed data to really see the ins and outs of the strategy at hand.
I get skeptical about some of the tests done in these videos sometimes, such as the fact that we do not know how the data set was selected, and it is difficult to go through the entire fast-forwarded portion of the video and verify that every losing trade was recorded, but that is why you need to go and back-test these strategies on your own! A few things I always notice when I test strategies from these videos:
- The optimal trade management for the setups is often not the way it was done in the video.
- They pretty much all use purely technical indicators and setups as their entries, and then a very close take-profit and slop-loss. I think this is the reason why they don't usually work in the long run. There are no fundamentals to back up the trade direction so it is just an uncontrolled dice-roll random gamble at that point. I once saw a comment on a Trading Rush video, that went something along the lines of "We will all someday be rich thanks to your MACD video!". And that just goes to show you what people will believe. You are not going to get rich off the MACD. If you could do that, then why would anyone do anything else for a living?
- The market they use might be different from yours and maybe even a completely different asset class (which does often move differently as different factors move each type of market)
- The results are different in reality (obviously), especially after you add in more data to the test.
- These videos do 100 trades on one market and time-frame and call it a day. Really, I like to see at least 500 trades on various markets.
- Besides, what's to say they didn't do the back-test on 10 different sets of data until they found one that performed well (basically curve-fitting the results) and posted that and that one only?
- Some of the strategies blatantly use criteria that you would not have seen until after the trade had played out, and you will almost never see these channels back-test in replay mode because of this.
I would not trade any of the strategies these people post mainly because of their purely technical naive nature, but you may be able to extract some ideas from them for position management (to back-test of course).
 Back to Blog